

Lifeboat Drills
Investing Risk ManagementNobody likes it when the stock markets decline. This week we see two economic superpowers “saber-rattling” about who will impose the largest tariff. Because threatened or imposed tariffs have real long-term consequences, the global stock markets have declined relatively sharply.
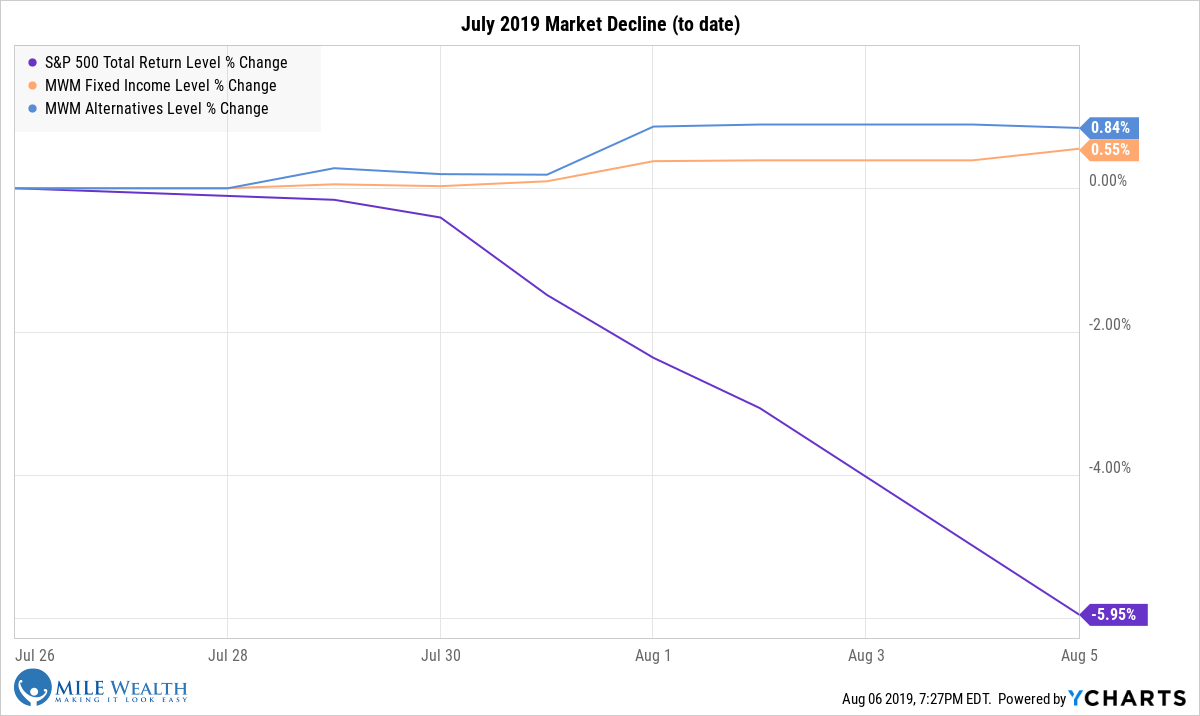
As I am writing this, the US stock market has declined 5.9% from its July peak. However, there is certainly no reason panic at this point because declines of these levels are normal market “noise.”
Warren Buffett has famously said, “It’s only when the tide goes out that you learn who has been swimming naked.” Essentially, he is pointing out how difficult it is to see how well protected we are when the stock markets are climbing. As it’s the rough times when we truly get to see how well we are covered.
I take advantage of these rough times to run “lifeboat drills.”
The right time to make sure your lifeboats are available and functional is when the seas get a little bumpy. At times when there is market stress, I look at client holdings and asset classes to make sure they are acting like I’m expecting. (These are my lifeboat drills.) If a holding is designed to provide protection, these downdrafts are the time to see how well it’s actually helping.
When the stock markets are showing weakness, I look at portfolios to see how my mix of fixed-income (bonds) investments and alternative investments (“alts”) are faring. Often, fixed-income investments are up during these periods (they are “negatively correlated”), so I run some charts and graphs to see if anything odd is going on with these holdings. Alternative investments are also diversifiers. However, they typically have some equity-like exposure, so I’m not surprised if these are down, but at lesser levels.
Let’s look at three recent market declines. The chart below reflects the stock market decline in early 2018, and it shows the expected dynamics of these asset classes well: US stocks dropped by 9.8% (purple line), alternative investments dropped by 4.2% (blue line), and fixed-income went up by 0.1% (orange line).

Caveats: The performance in these charts are showing benchmark information;
they are not a reflection of any one client portfolio as each client’s investments are
individually managed. Of course, past performance is no guarantee of future results.
After examining the information above, I was not happy with how much the alternatives dropped during this period. So, I decided to make some small tweaks to the holdings to better protect client assets from future stock market declines. In other words, I saw that one of the lifeboats was not in an ideal condition, so I fixed it long before anyone needed to use it.
The end of 2018 saw a decline that was deep enough to qualify as the first bear market (20% decline) in the last decade. The chart below shows the protection that fixed-income and alternative investments provided: fixed income was up by 0.5%, alts were down by 3.4% , while US stocks were down close to 20%.

Most recently, tweets and tariffs are spooking the global stock markets. In this short period, I’m happy to see that fixed-income holdings and alts are both showing strength.
Nobody knows when this turbulence will end. However, I’m monitoring the situation closely to make sure working lifeboats are in place in case things get really bumpy.
Other items you might want to read:
Loading Posts...